Umbrella lines are candles with very long lower shadows and a small real body at the top end of the range. The long lower shadow should be at least twice the height of the real body. And there should be no or a very short upper shadow. The color of the real body is not import. It can be red or green. If an umbrella line emerges during a downtrend, it is a signal that the downtrend should end. In such scenario, this umbrella line is labeled a hammer.
The reversal power of a hammer is relevant to the following factors:
1.The smaller the real body and the longer the lower shadow, the more likely the downward trend to be reversed.
2.The longer the token price has been falling and the greater the amplitude, the more trustworthy the hammer reverse signal will be.
3.Generally speaking, green body(bull) hammer is more powerful than the red one.
4.The hammer needs to be confirmed by other technical indicators.
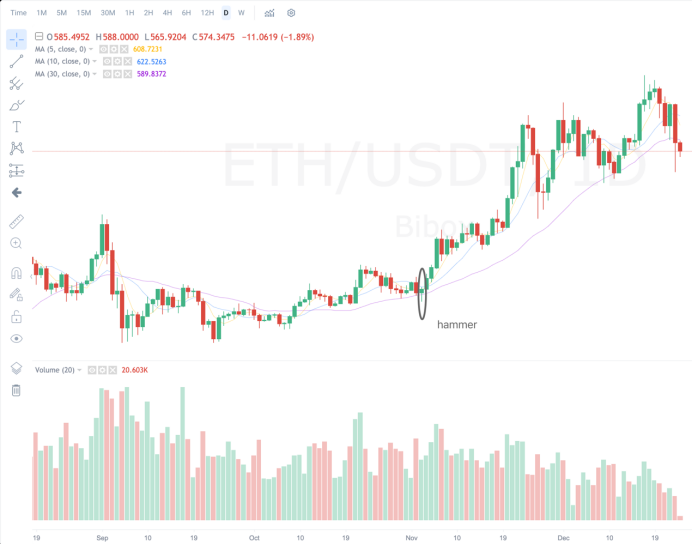
The following graph presents the daily candle lines of ETH/USDT. With a downward trend that between Oct.23 and Nov.2, a hammer showed up on Nov.3. On the following day, MA 5 crossed over MA 10, forming a ‘golden cross’which is a sign of buying. No surprise that ETH’s price started to rise.
If the umbrella lines show after a rally, it is a potential top reversal signal ominously called a hanging man. If the real body is the red one(bearish), it is more likely for the price to go down.
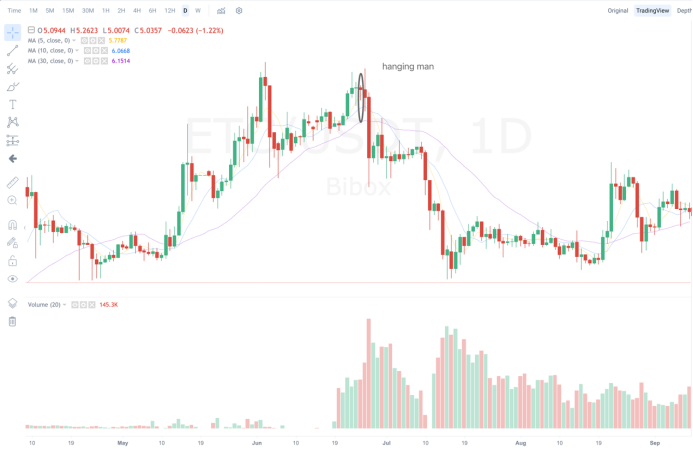
The following graph presents the daily candle lines of ETC/USDT. In 2019, after a rally, on June 24 and 25 showed a doji and a hanging man. These are signals to be taken seriously for price to be reversed. On June 26, when the downward trend started, there showed a long bearish candle, a further signal of price decline. Besides that, MA5 crossed under MA10 and MA30 on 27th and 28th respectively, forming ‘dead cross’. With this many price declines signals, ETC plummet 38% until a hammer showed on July 15th.
There are three aspects that differentiate the hanging man from the hammer:
1.Ahammer comes after a decline while a hanging man comes after a rally
2.Ahammer is valid even if it comes after a short-term decline, but a hanging man should emerge after an extended rally, preferably at an all-time high
3.A hanging man should be confirmed while a hammer need not be.
Please note that these signals mean there is the likelihood that the trend will be reversed. It won’t happen in all cases. Investors may need to take other information into consideration and make investment decisions. Digital market is changing all the time, I wish that with an understanding of candle lines and other technical indicators, you can have a more precise estimation of the market.
If you are interest in trading strategies, you can join Bibox quantitative strategy group https://t.me/bibox_trading_bot to discuss market trend with others.